Track Your Blood Pressure
Log your BP, pulse and heart rate in seconds — and walk into every doctor's visit prepared.
- No account needed
- Private by design
- Free to start
Built to make blood pressure simple to keep up with
From a five-second log to a doctor-ready report — BPlus handles the whole loop, without the clinical clutter.
Log in seconds
Add systolic, diastolic and pulse with a couple of taps — no friction, no clutter.
Scan your monitor
Point the camera at your own BP monitor and BPlus reads the numbers for you.
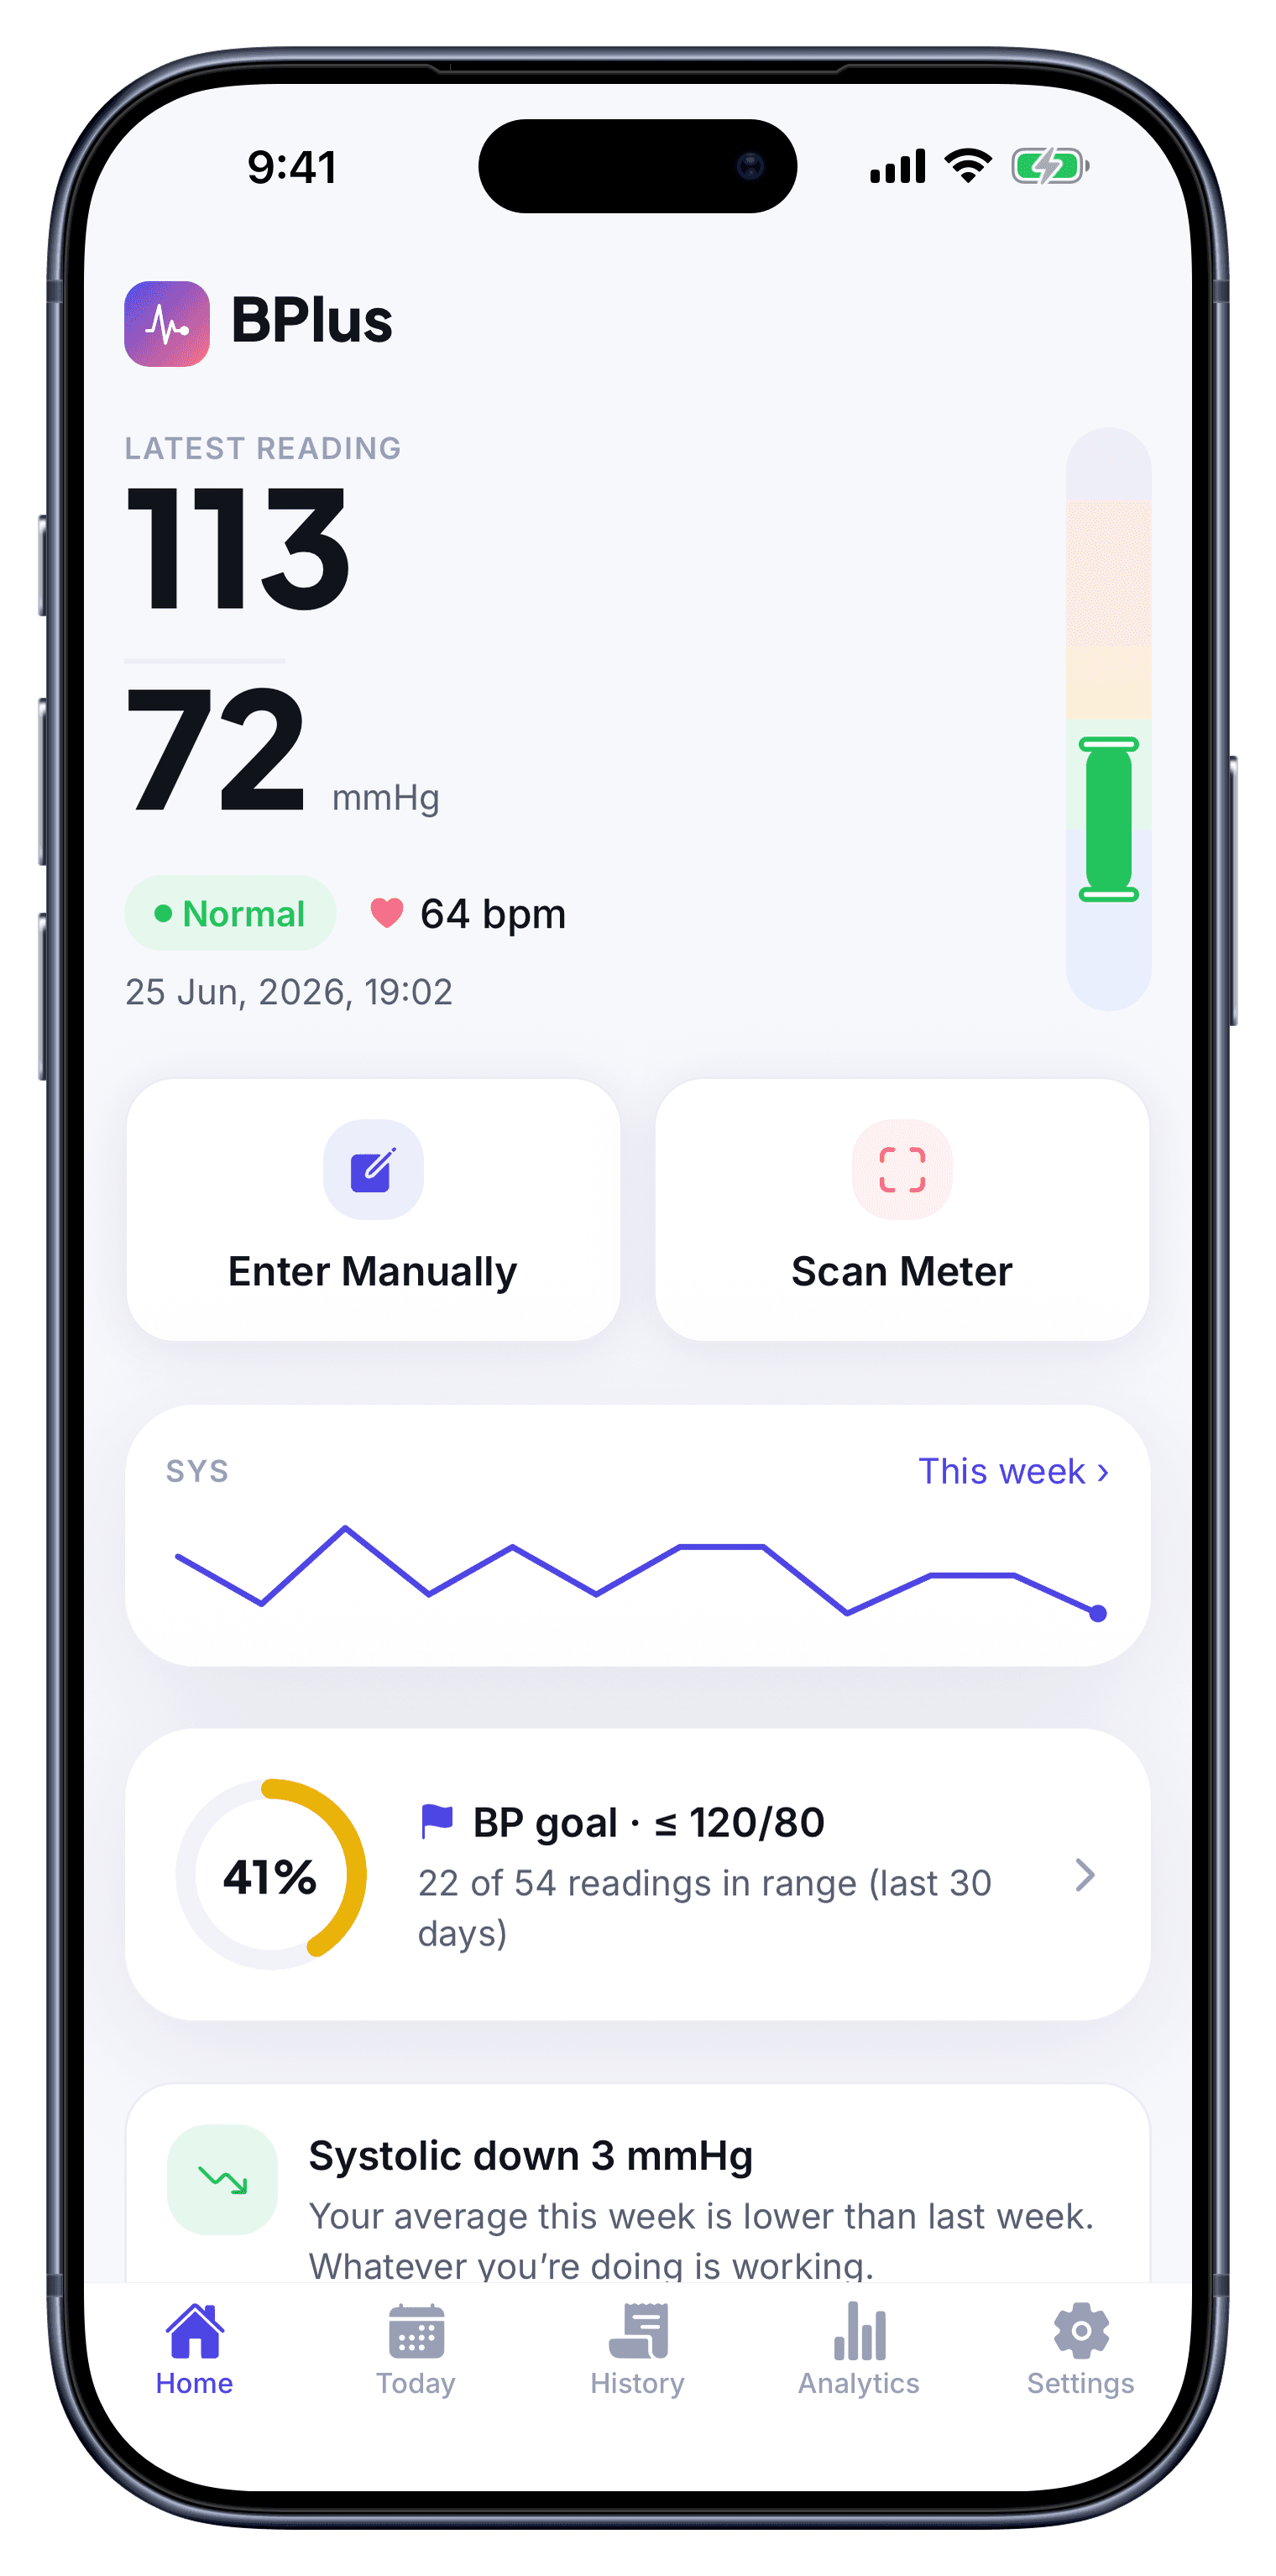
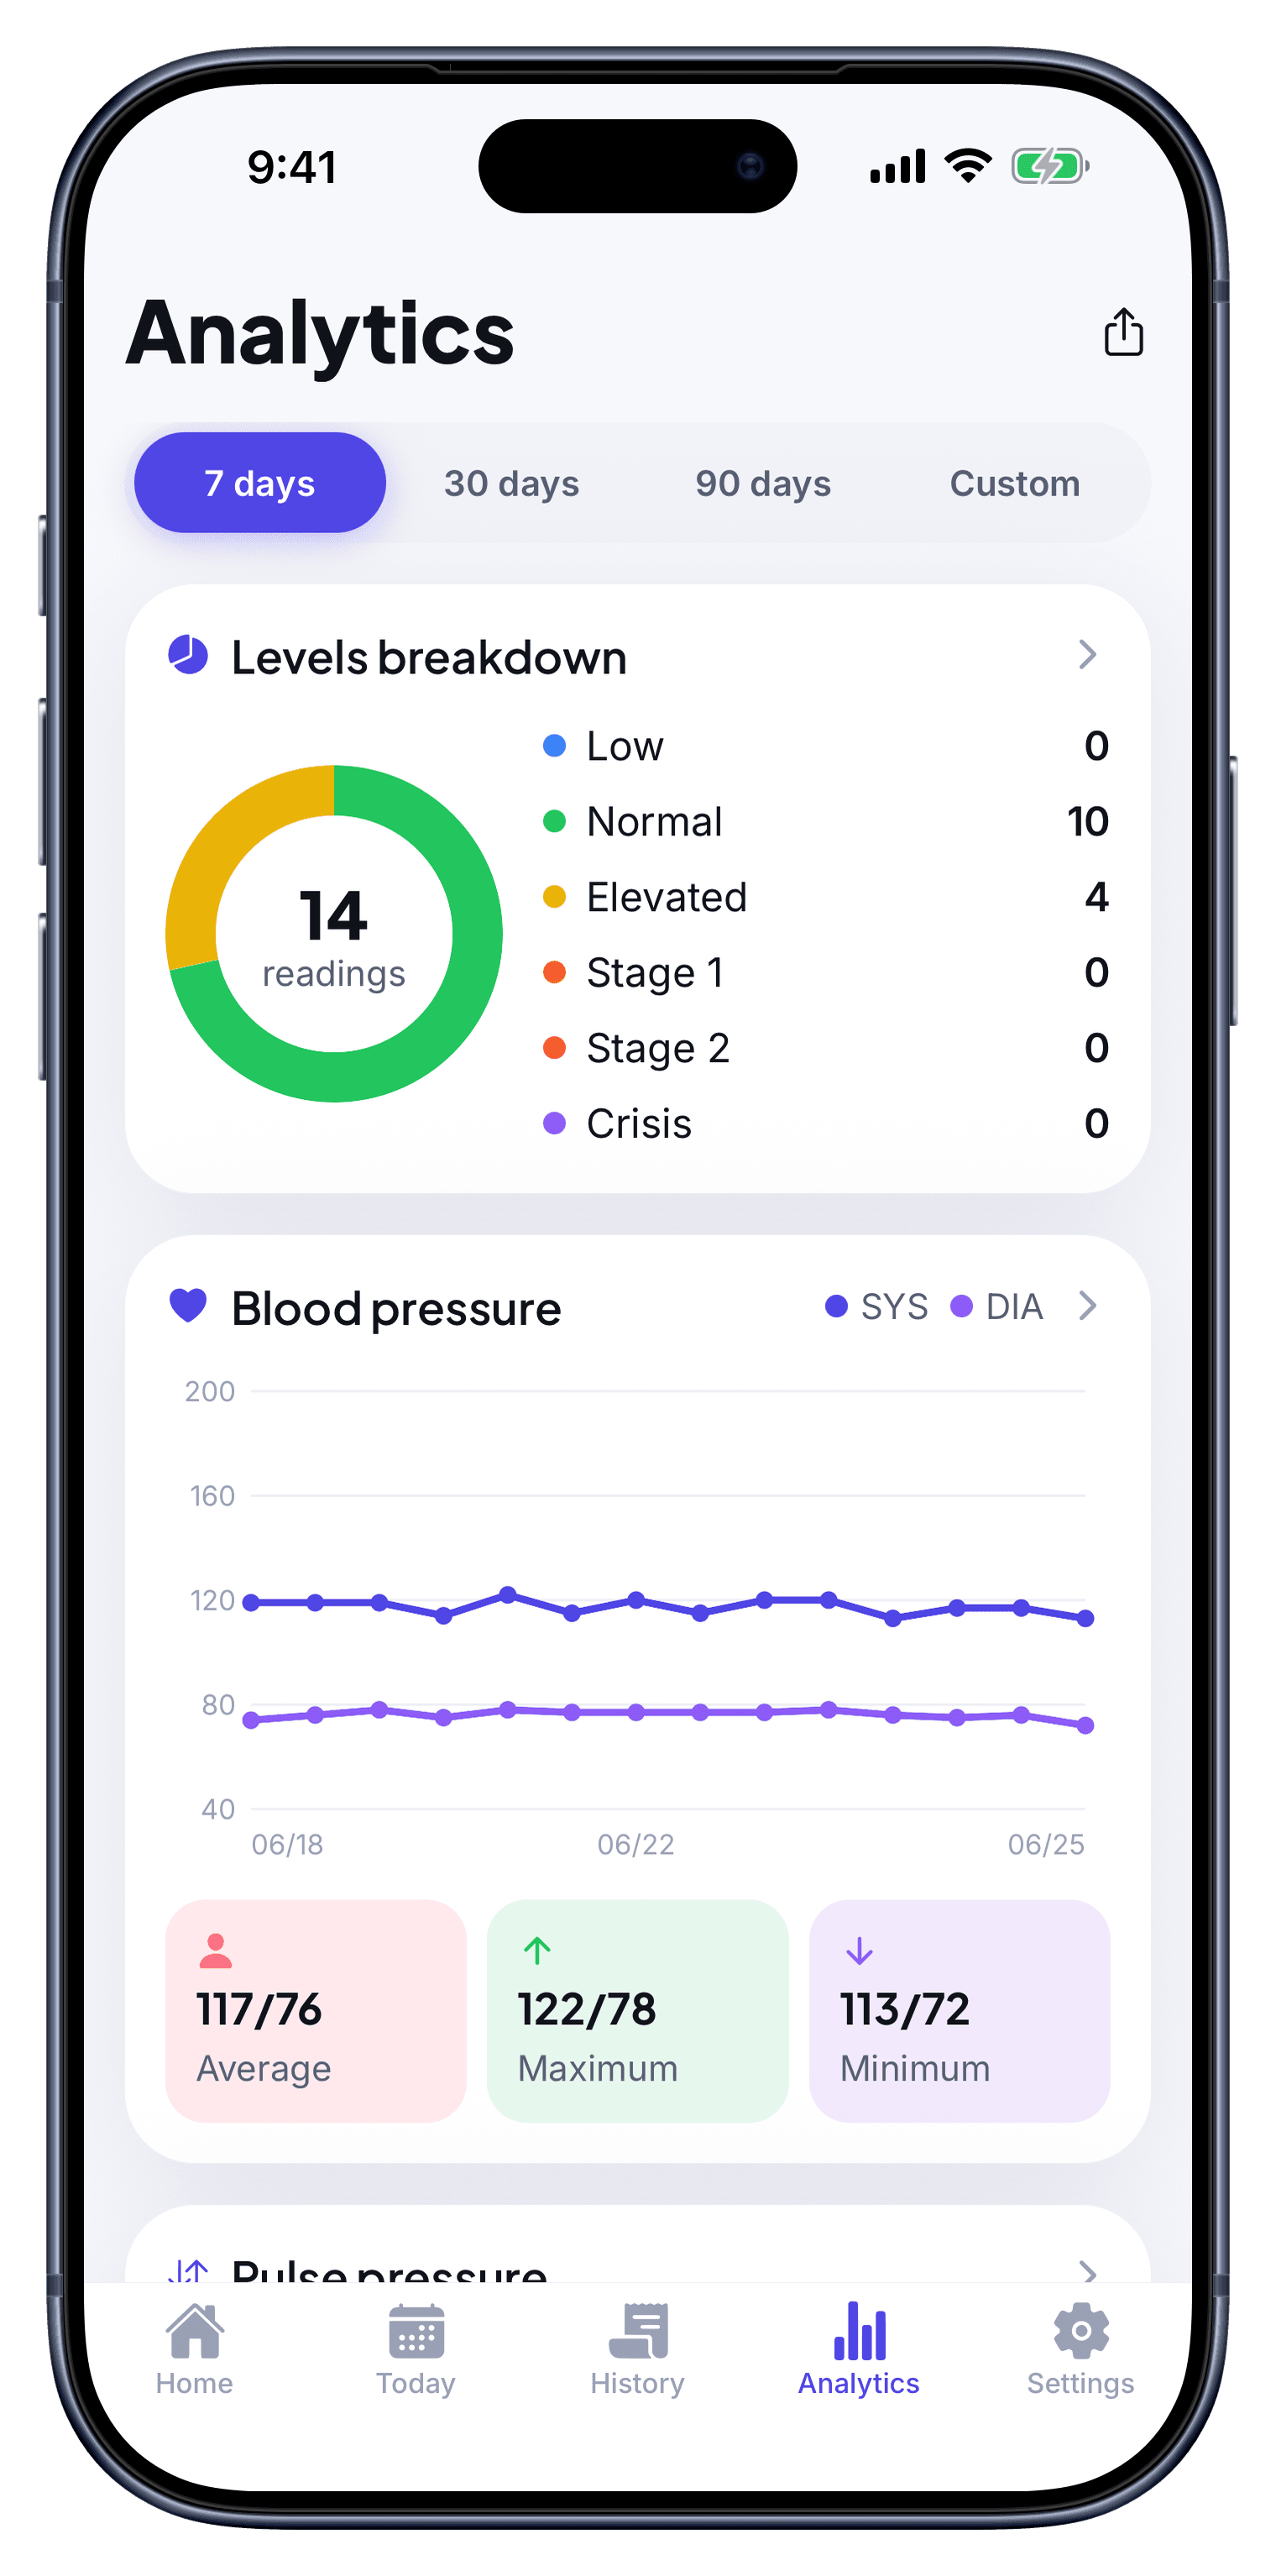
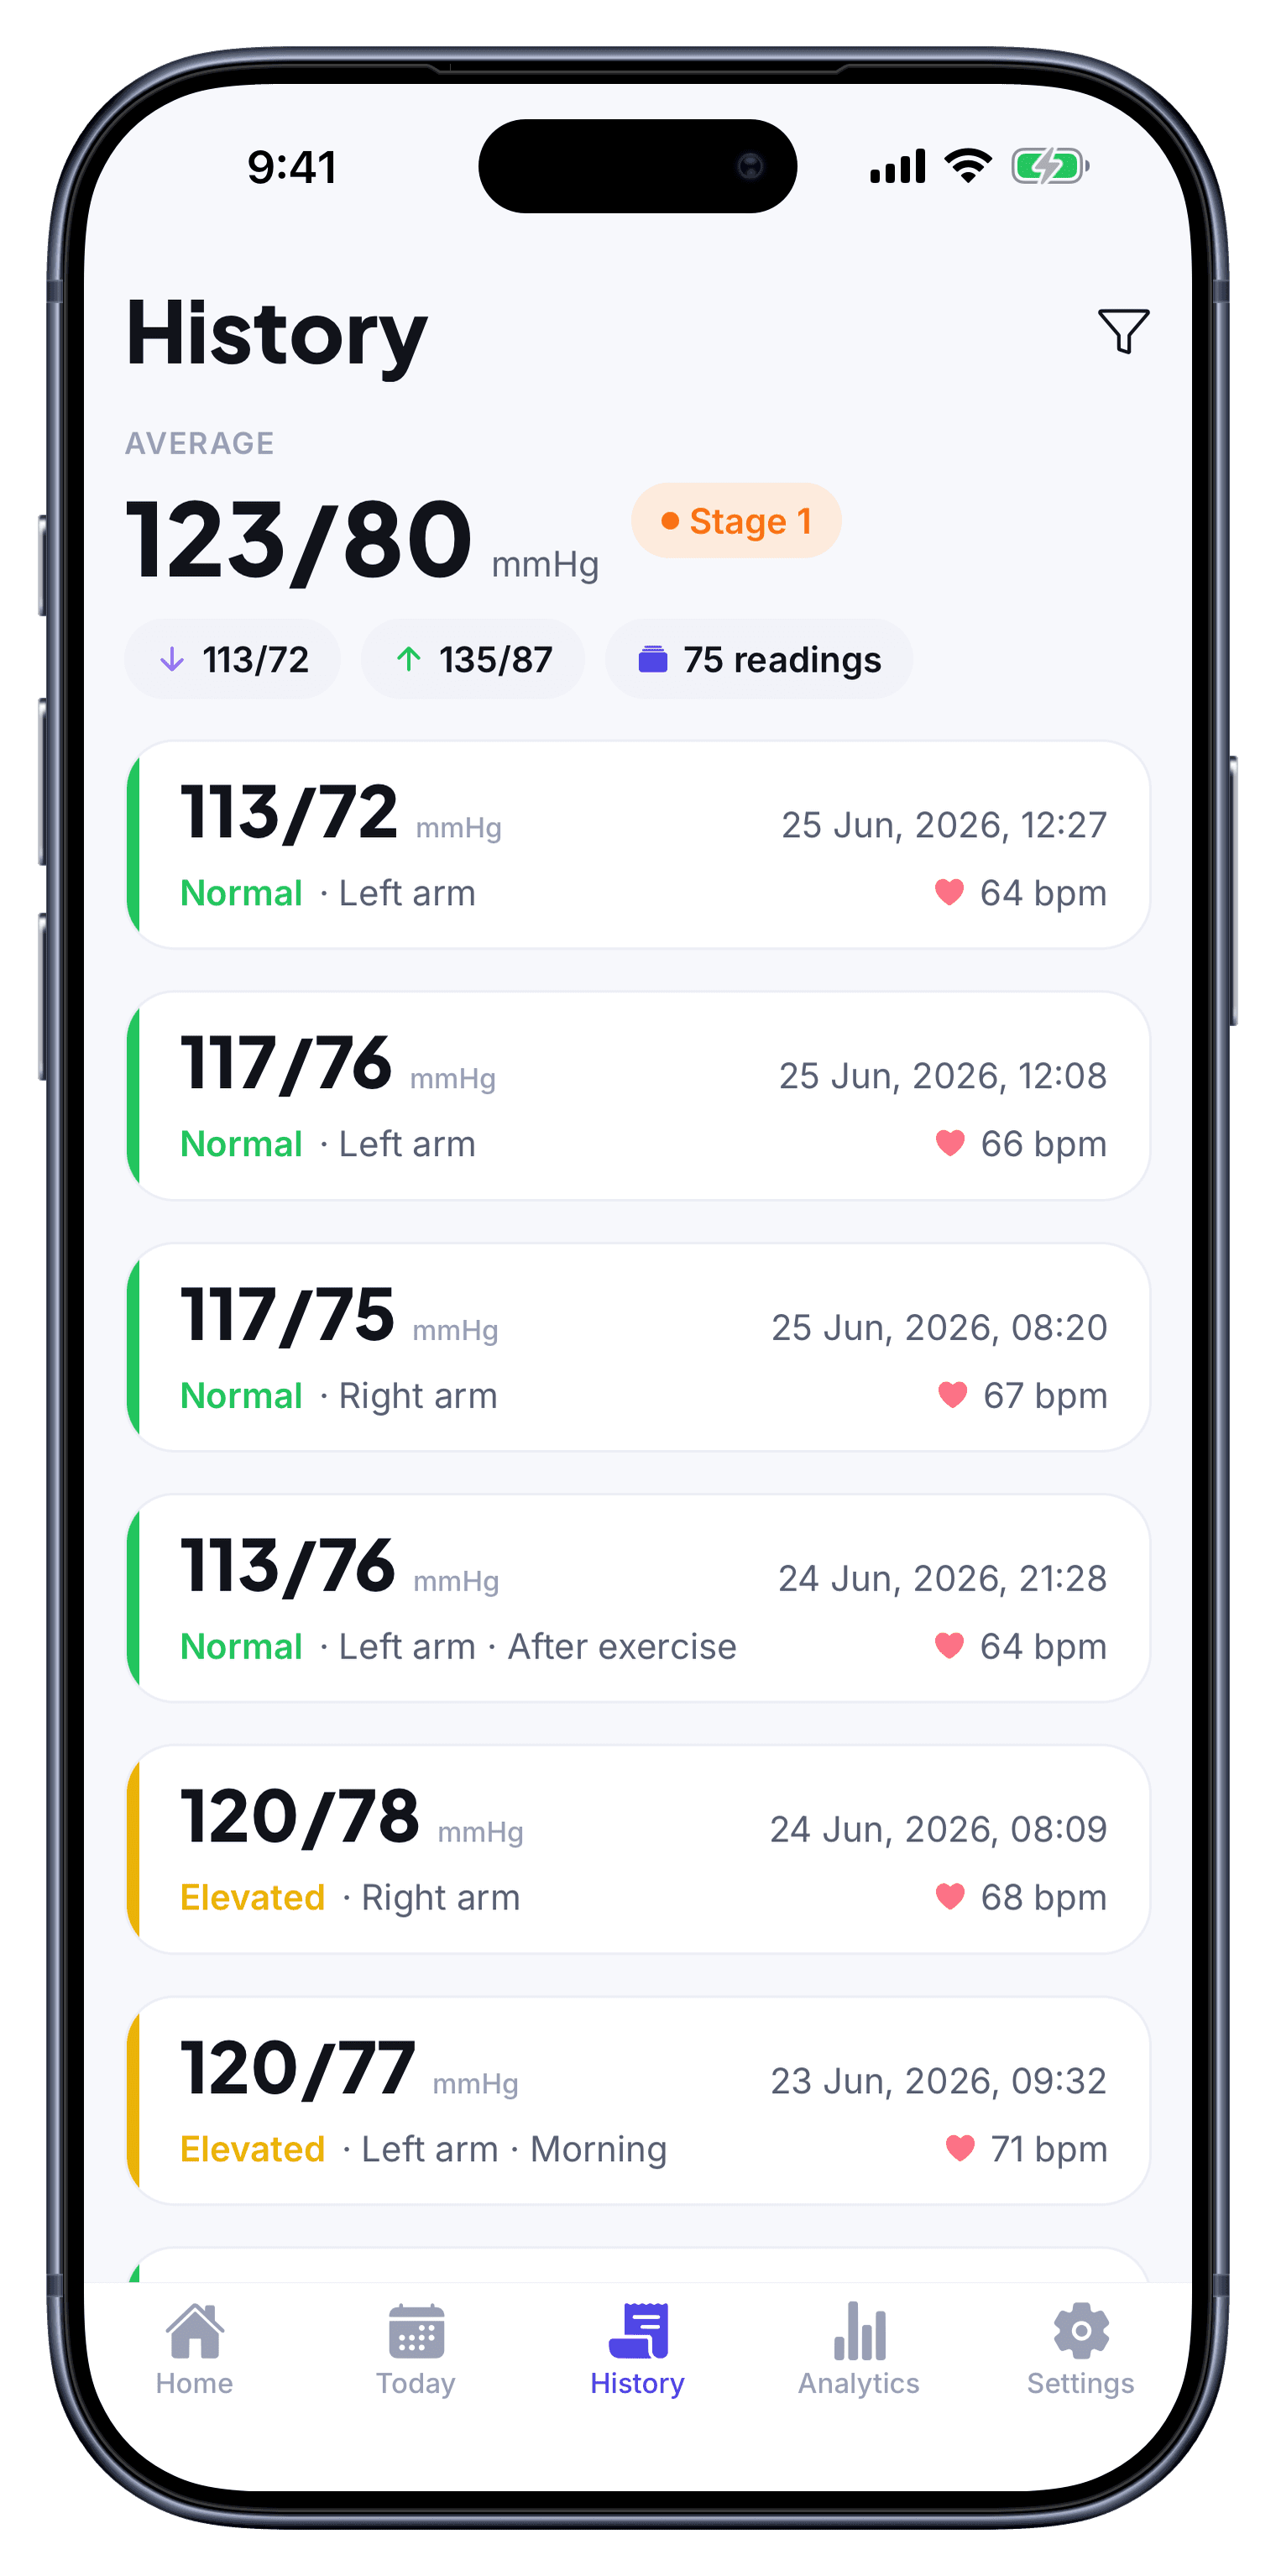
Color-coded categories
Every reading is sorted into Normal, Elevated, Stage 1, Stage 2 or Crisis at a glance.
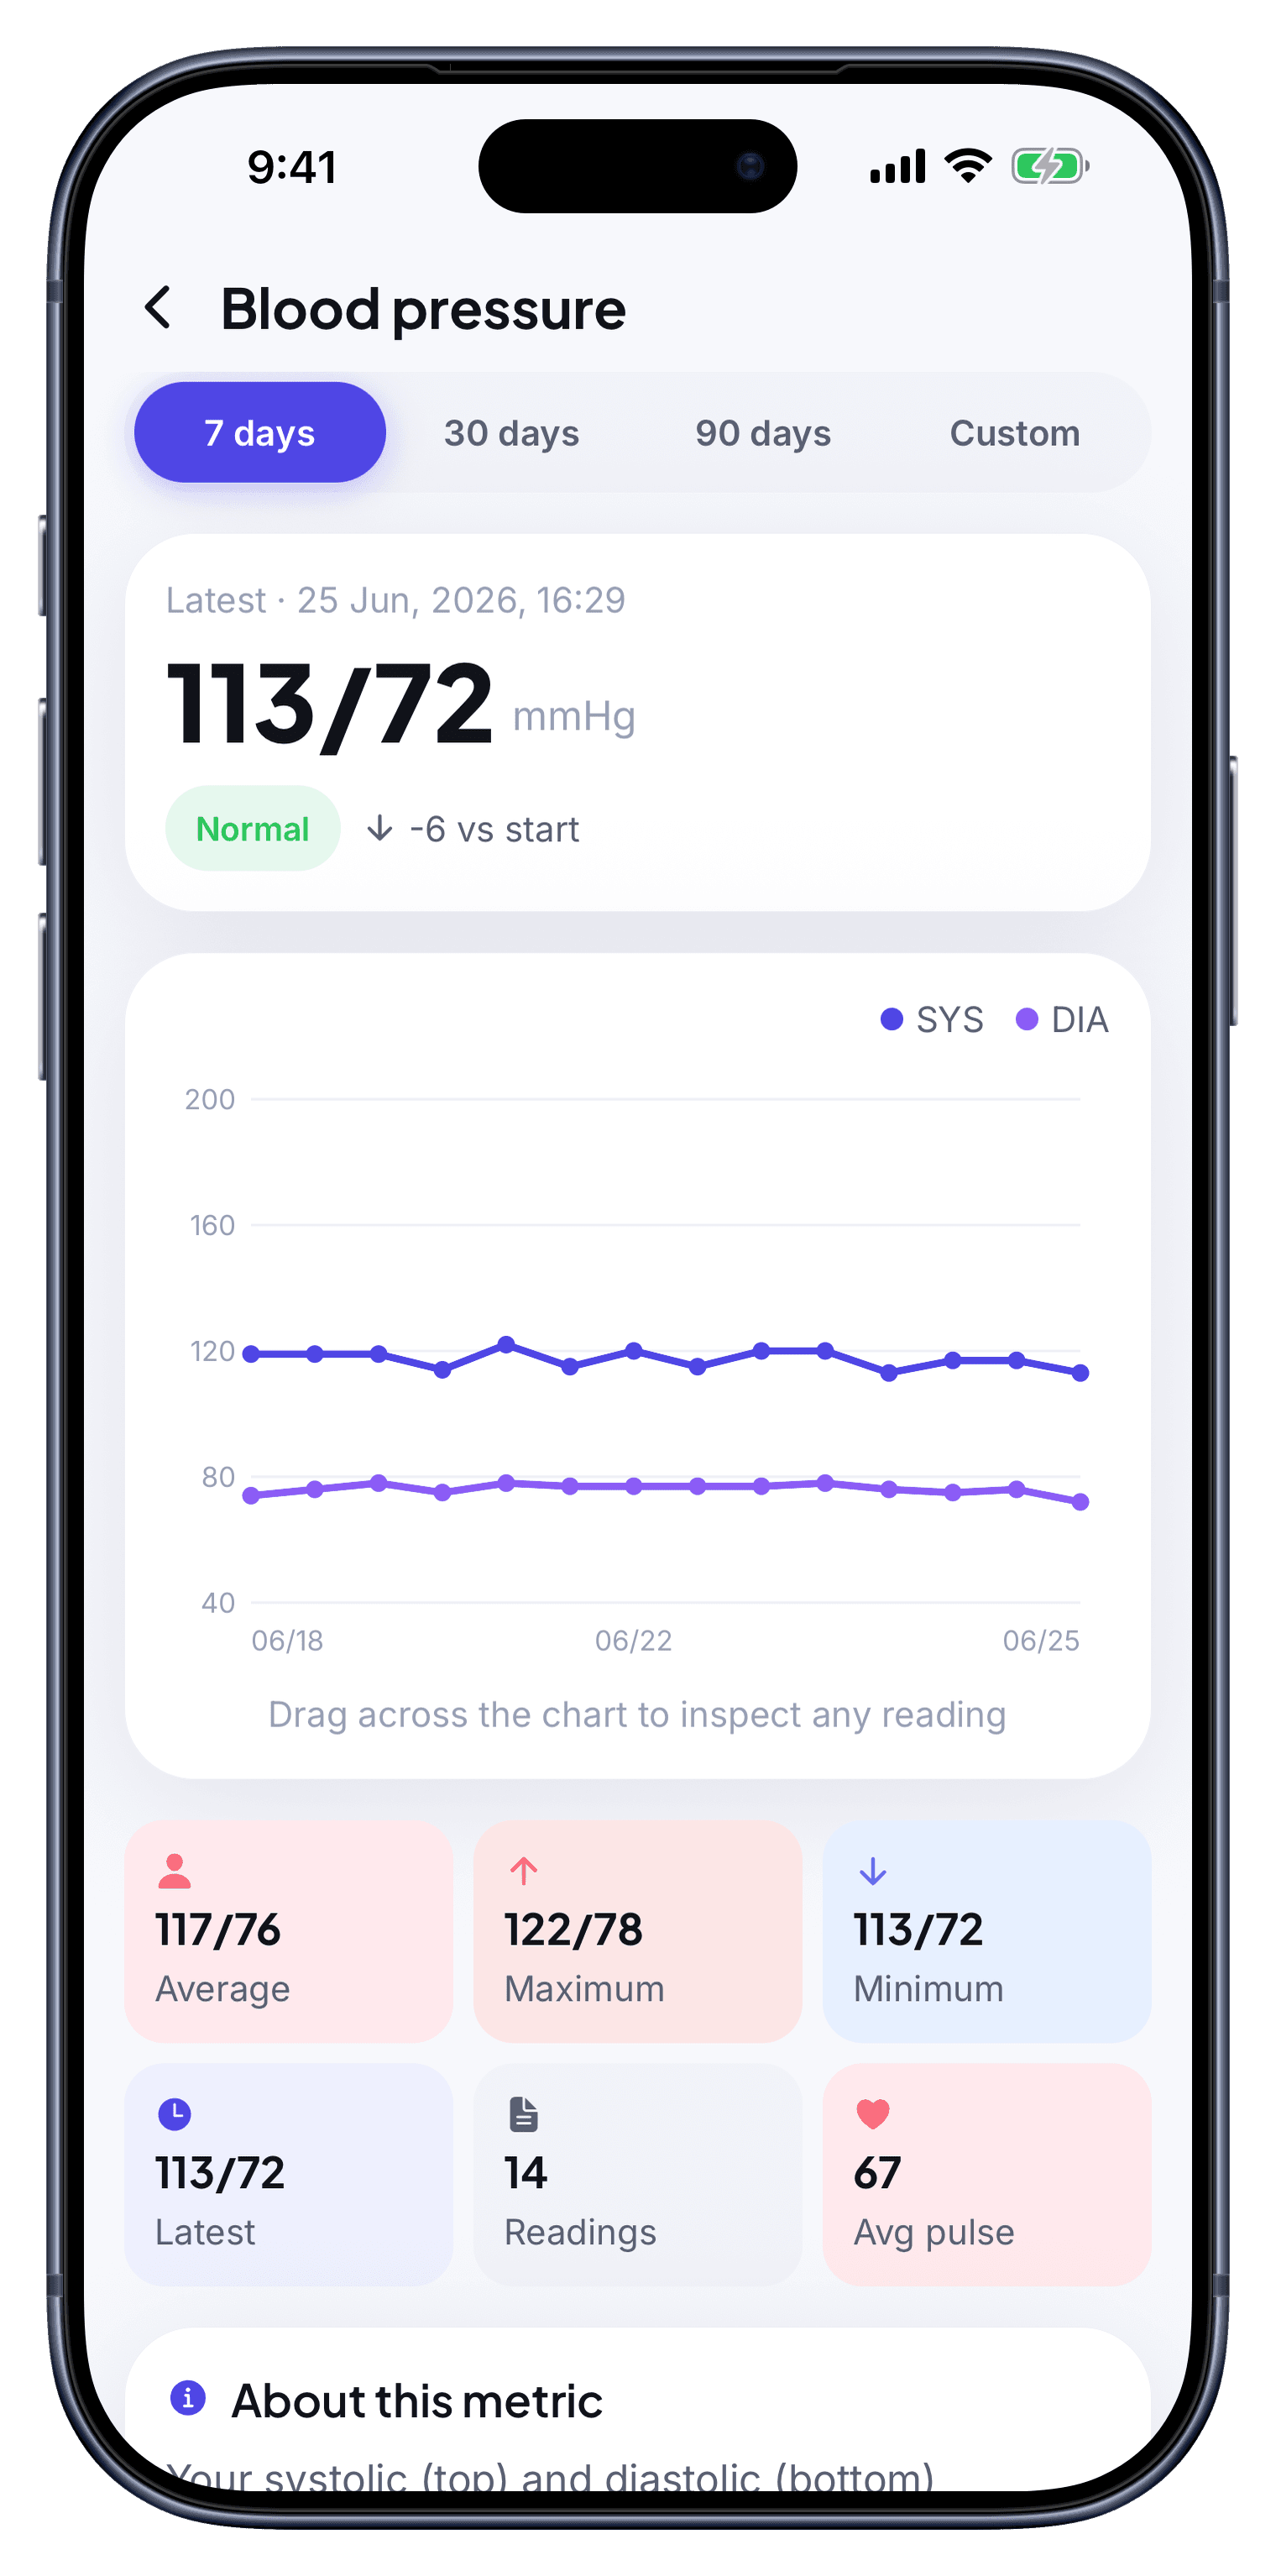
Trends & charts
Watch systolic and diastolic move over days, weeks and months on clean charts.
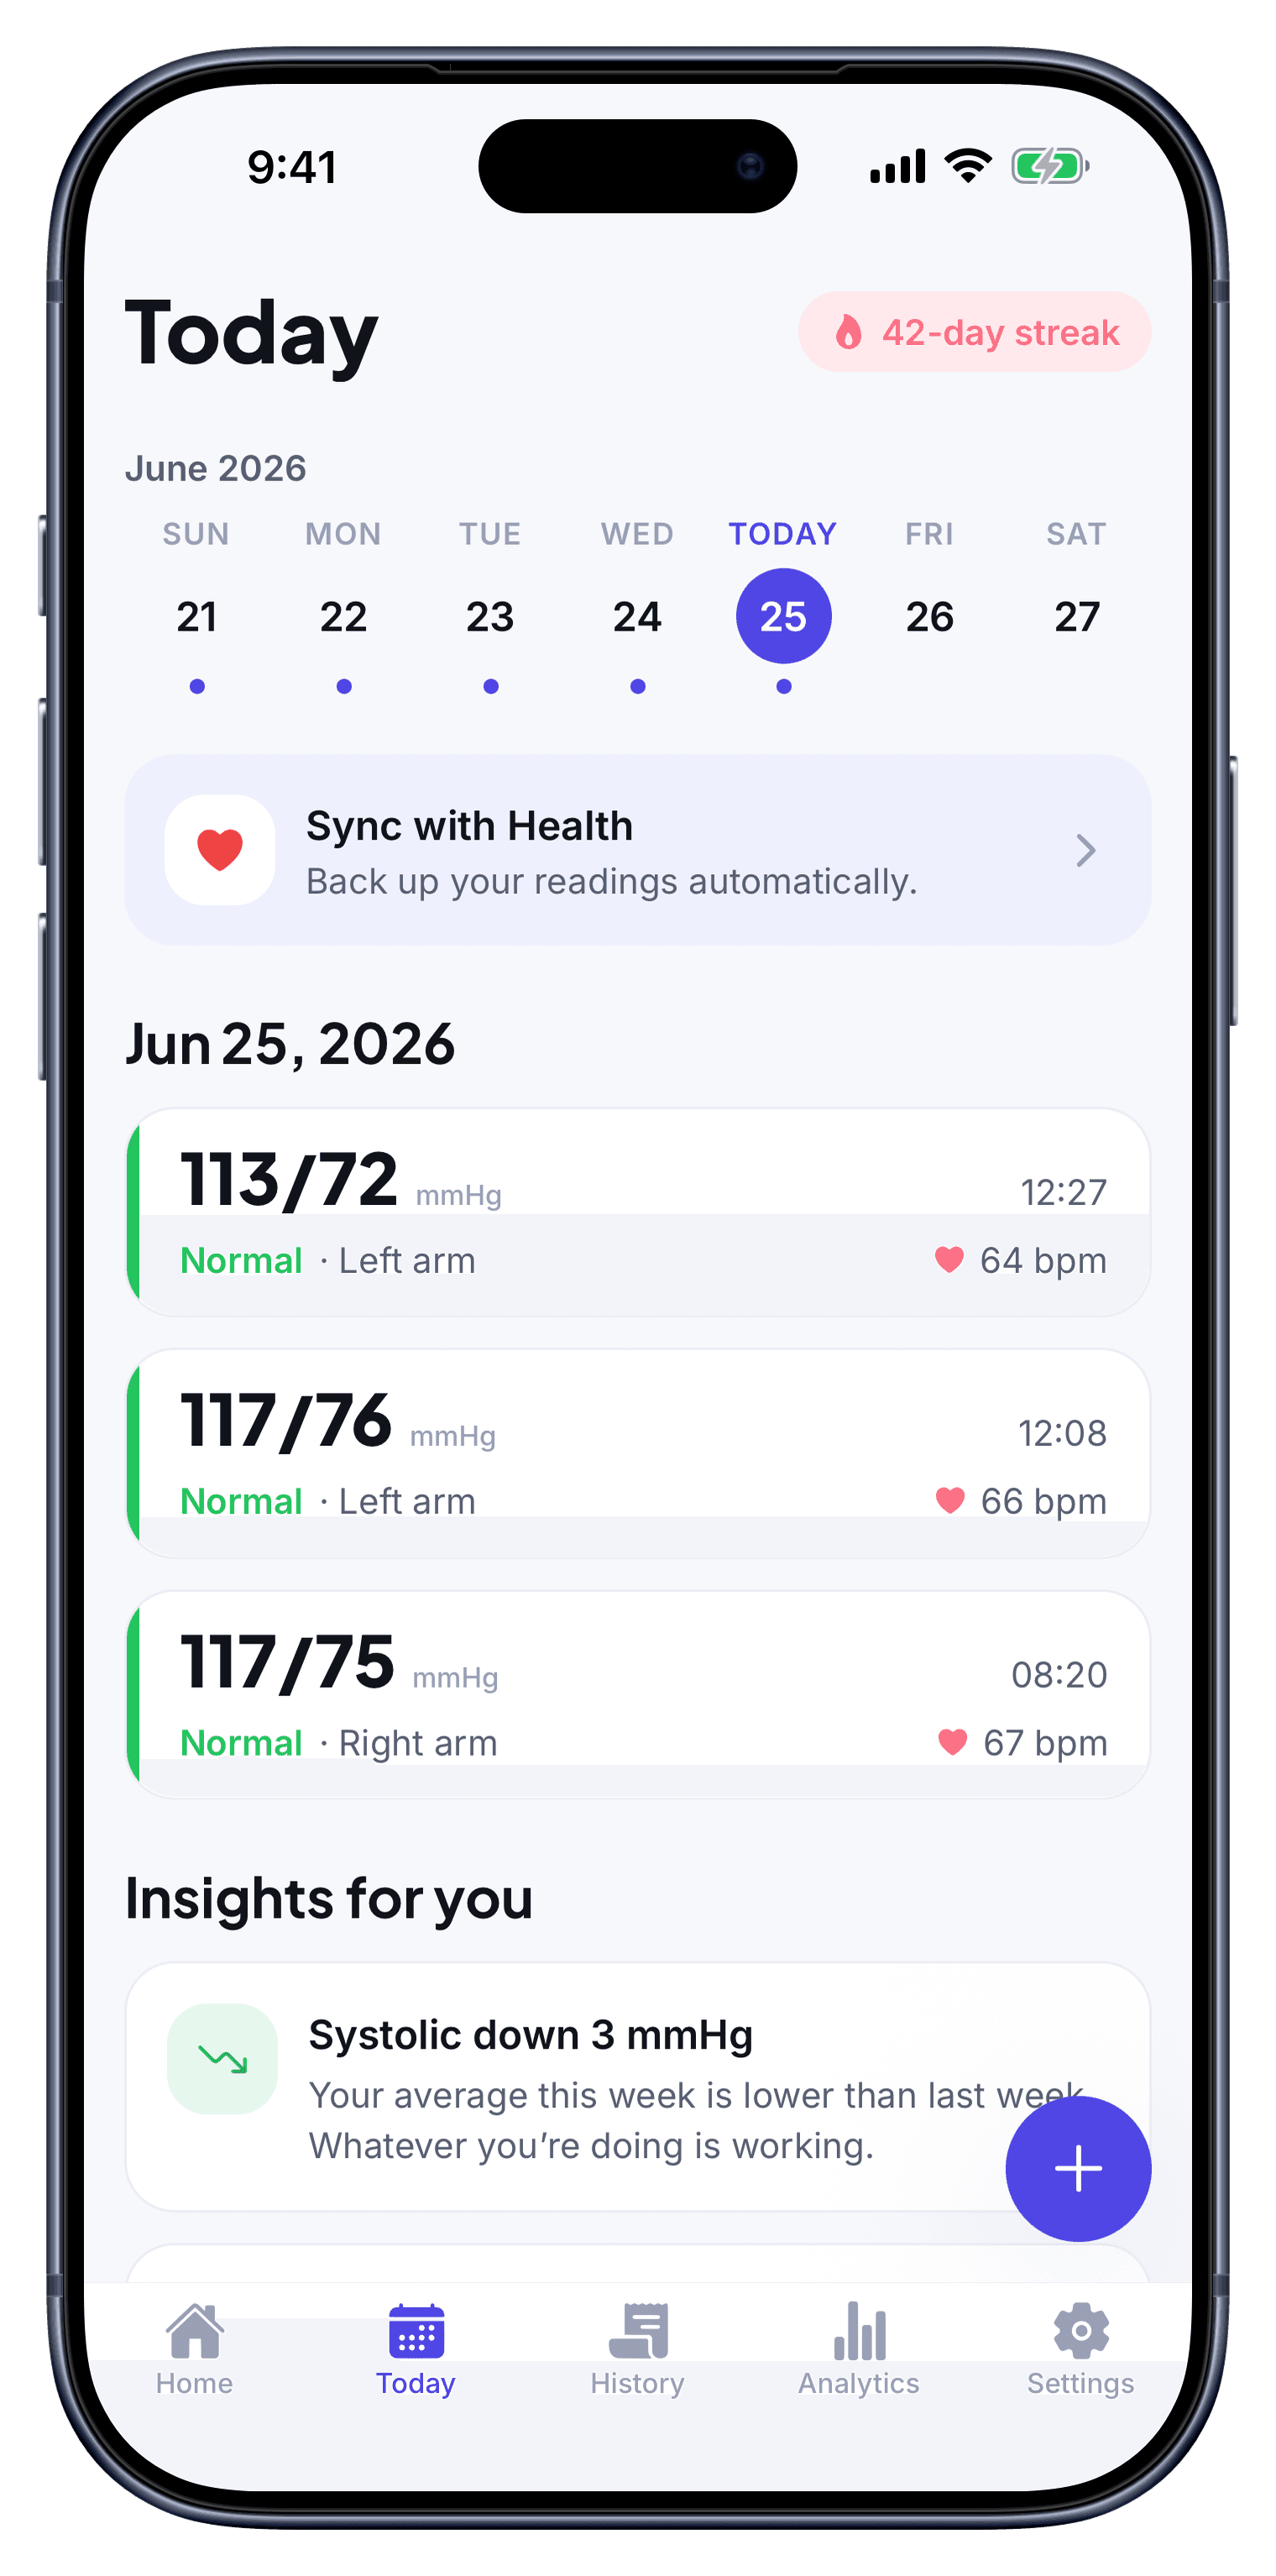
Smart insights
“Systolic down 3 mmHg this week.” Plain-language nudges, drawn from your own data.
Goal tracking
Set a target like ≤ 120/80 and see how many recent readings are in range.
Full history & diary
A complete, searchable log of every reading — with notes, time of day and category.
Daily reminders
Gentle nudges to take a reading at the times that work for your routine.
Medication reminders
Stay on schedule with reminders for the medications you take.
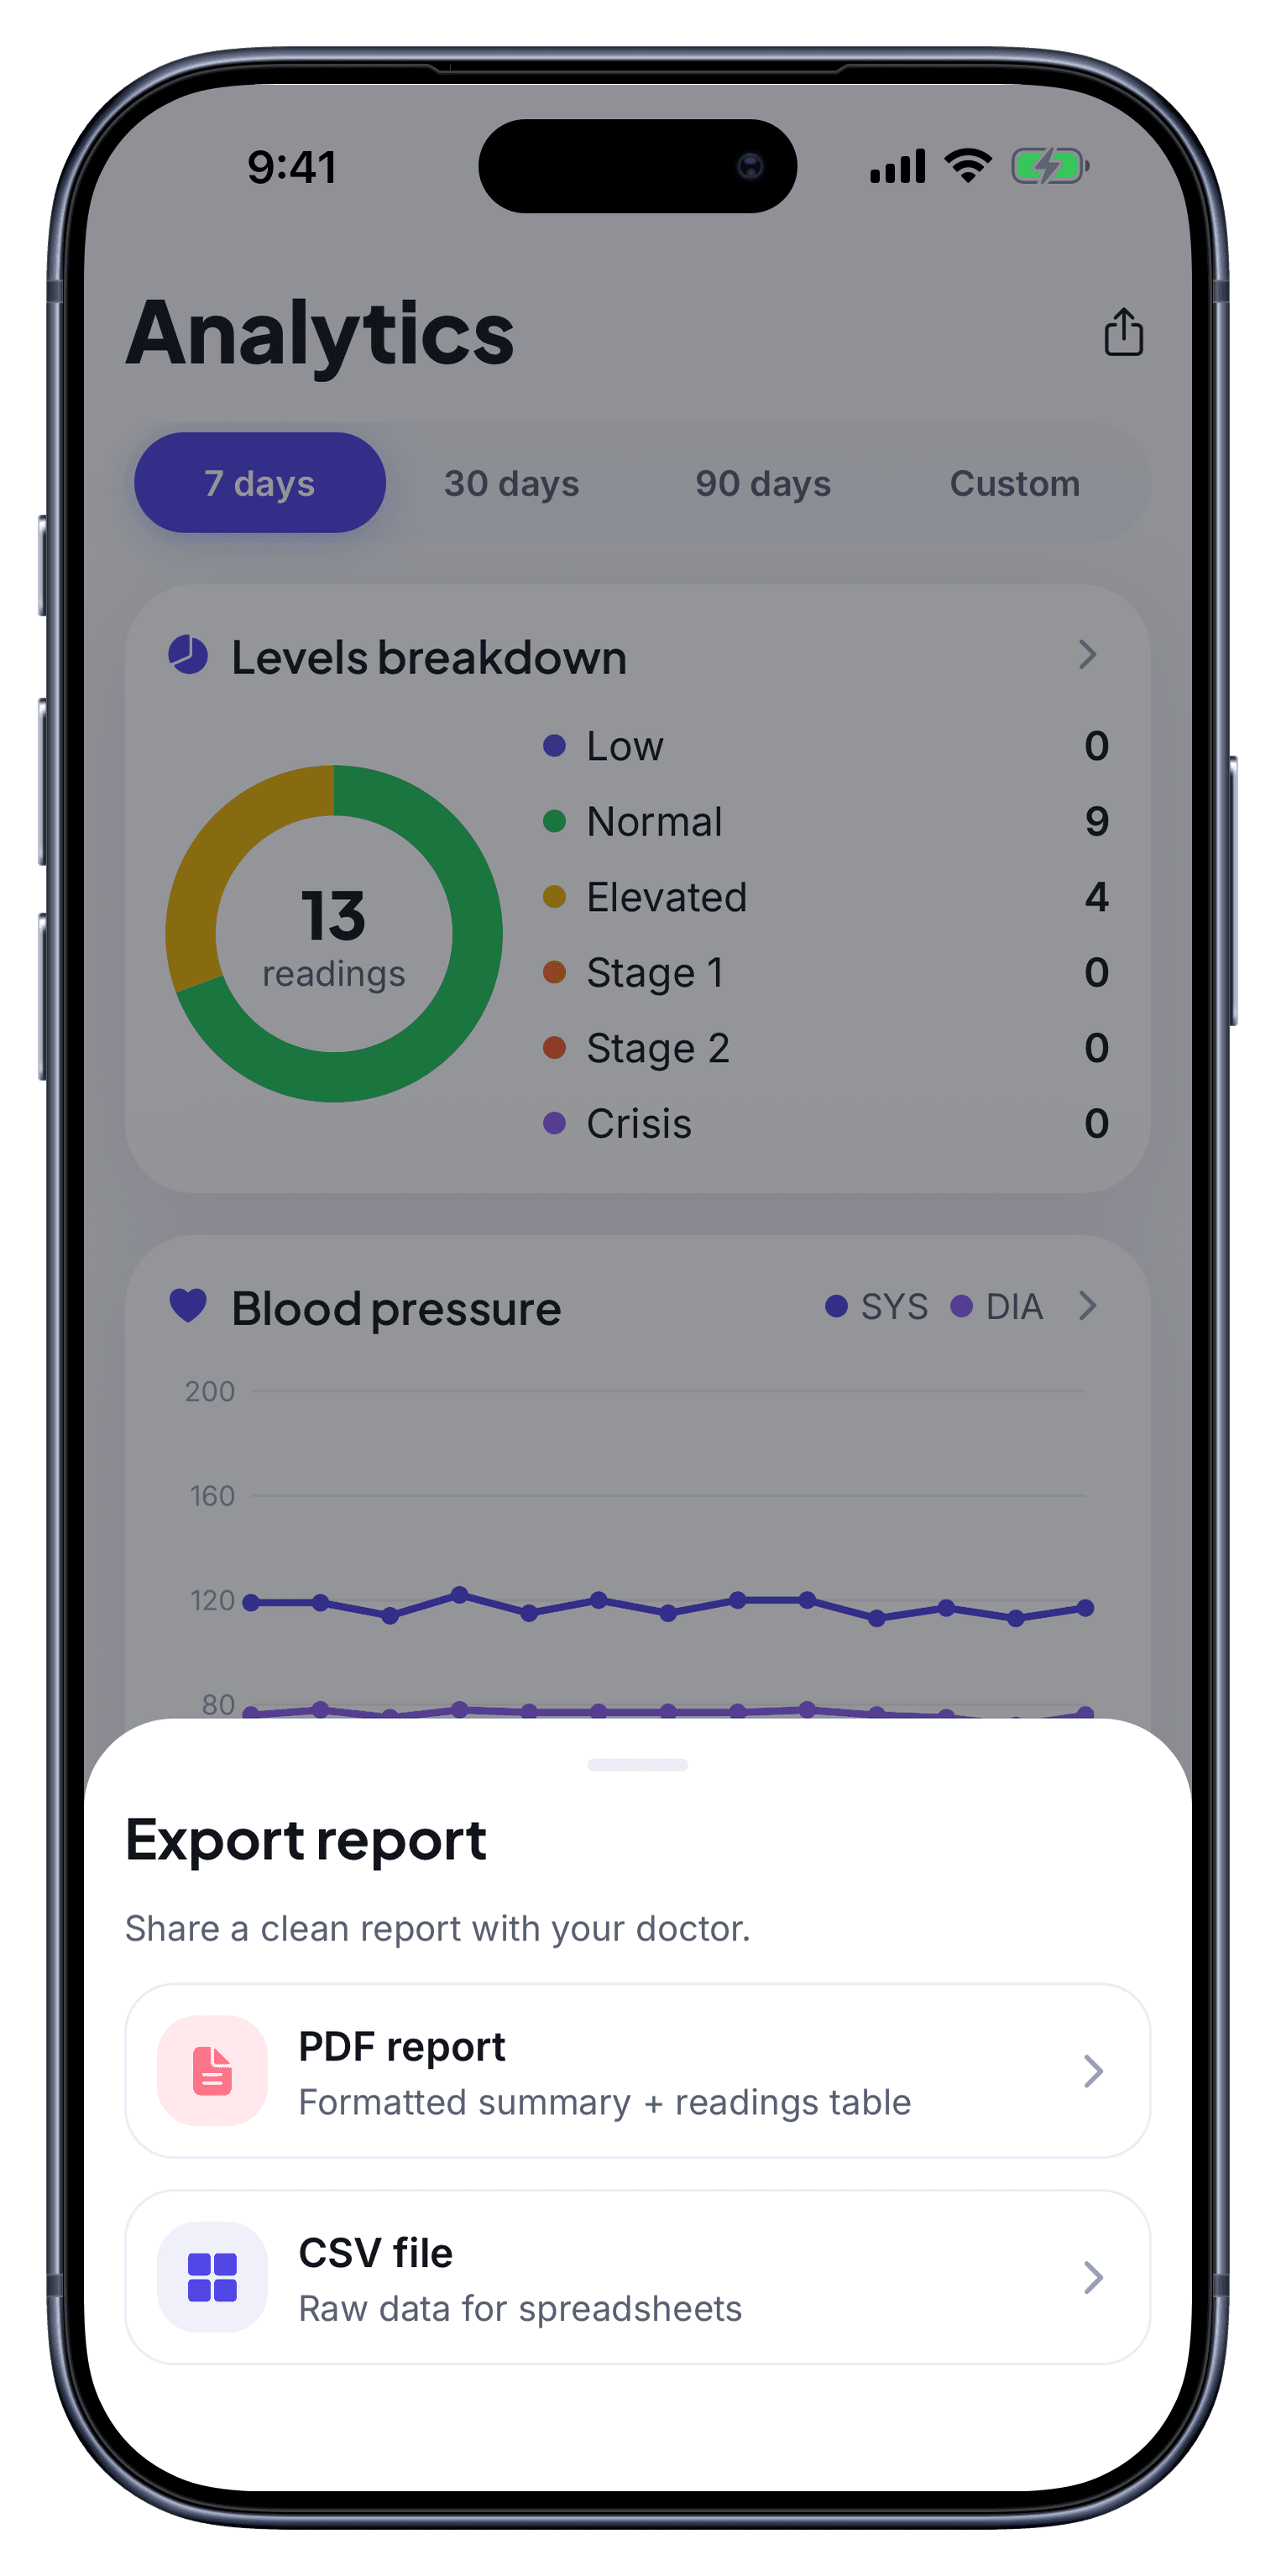
Doctor-ready reports
Export a clean PDF or CSV to bring to — or send before — your next appointment.
Apple Health & Health Connect
Optionally sync readings with Apple Health or Health Connect — under your control.
Private, on-device data
No account needed. Your readings stay on your device, not on our servers.
From a quick reading to a report your doctor can use
No clinical jargon, no setup marathon. Log, understand, share — that's the whole loop.
Log or scan a reading
Type your numbers in seconds, or point the camera at your own monitor and let BPlus read them.
See your trends & insights
Charts, averages and plain-language insights turn a list of numbers into a story you can read.
Export a report for your doctor
One tap turns your history into a clean PDF or CSV to bring to your next appointment.
The real app, screen by screen
Every screen here is the live product — calm, color-coded and quick.
Questions, answered
The short version — what BPlus is, and just as importantly, what it isn't.
No — you enter readings manually or scan them from your own blood-pressure monitor with the camera. BPlus organizes and tracks them; it never measures blood pressure from your body or your phone.
Start your blood-pressure log today
It takes one reading to begin. Log it, track it, and bring real numbers to your next visit.
Normal · Elevated · Stage 1 · Stage 2 · Crisis