Log, understand, share — three steps
BPlus is the calm space between taking a reading and talking to your doctor. Here's the whole flow.
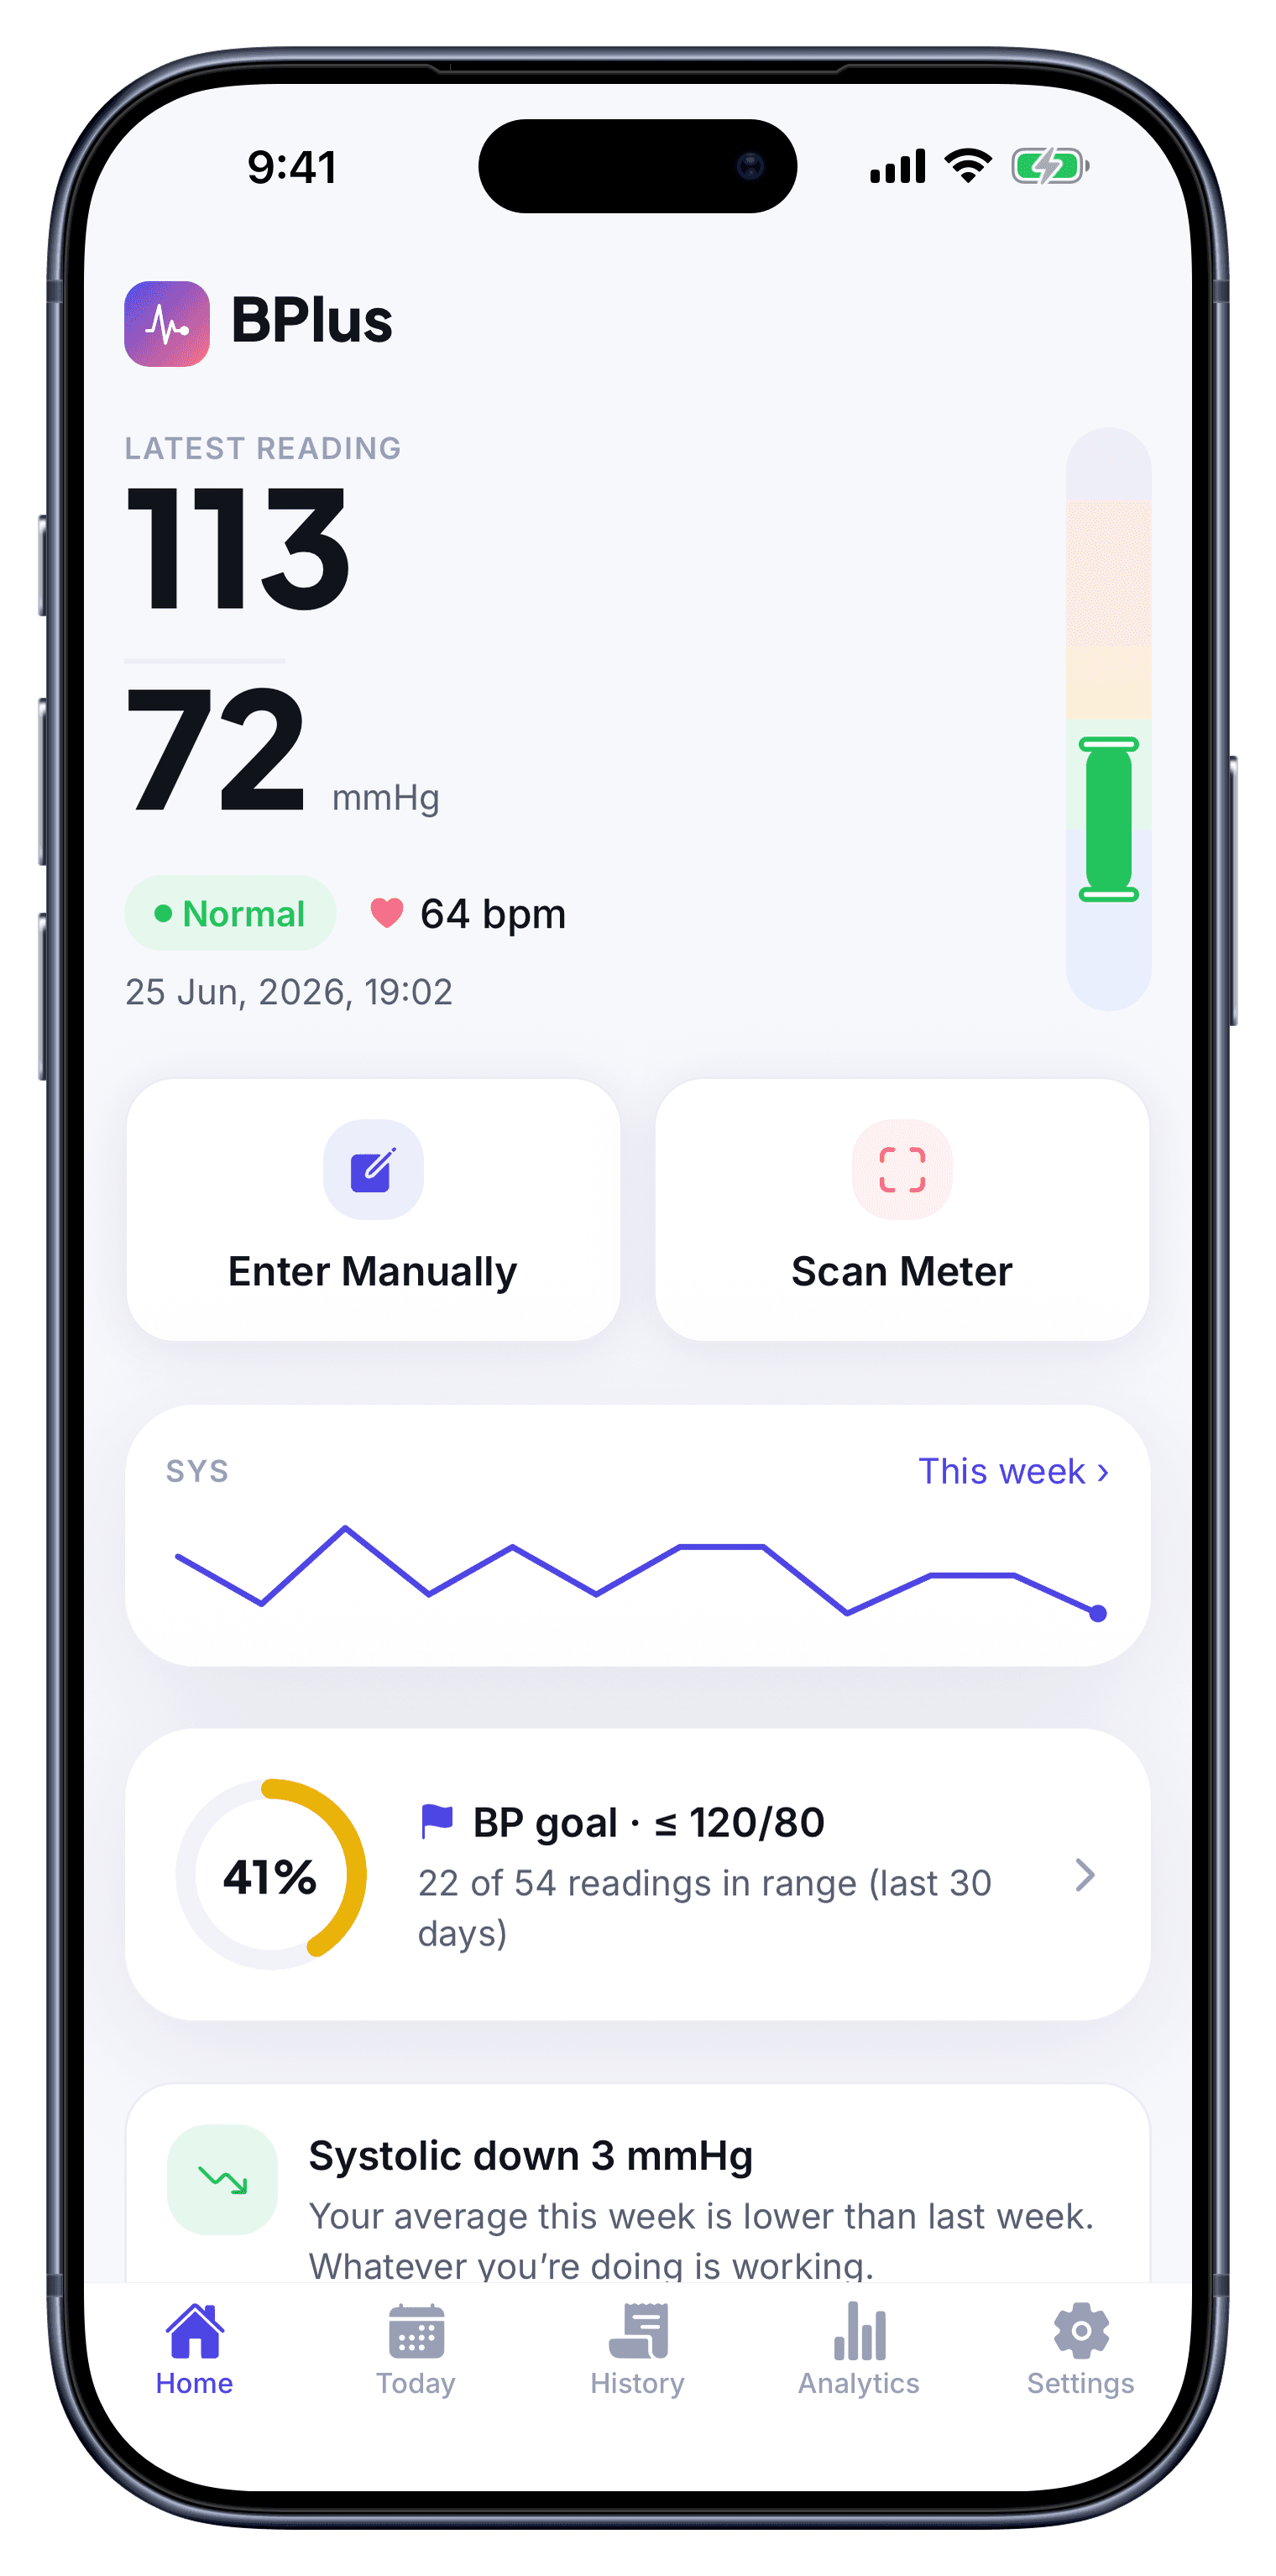
Log or scan a reading
Open BPlus and add a reading the way that suits you. Tap in your systolic, diastolic and pulse by hand, or use Scan Meter to hold the camera over your home blood-pressure monitor — BPlus reads the figures off its display so you just confirm and save. Each entry is time-stamped and sorted onto the color-coded scale automatically.
- Manual entry or camera scan
- Pulse / BPM captured too
- Auto-categorized Normal → Crisis
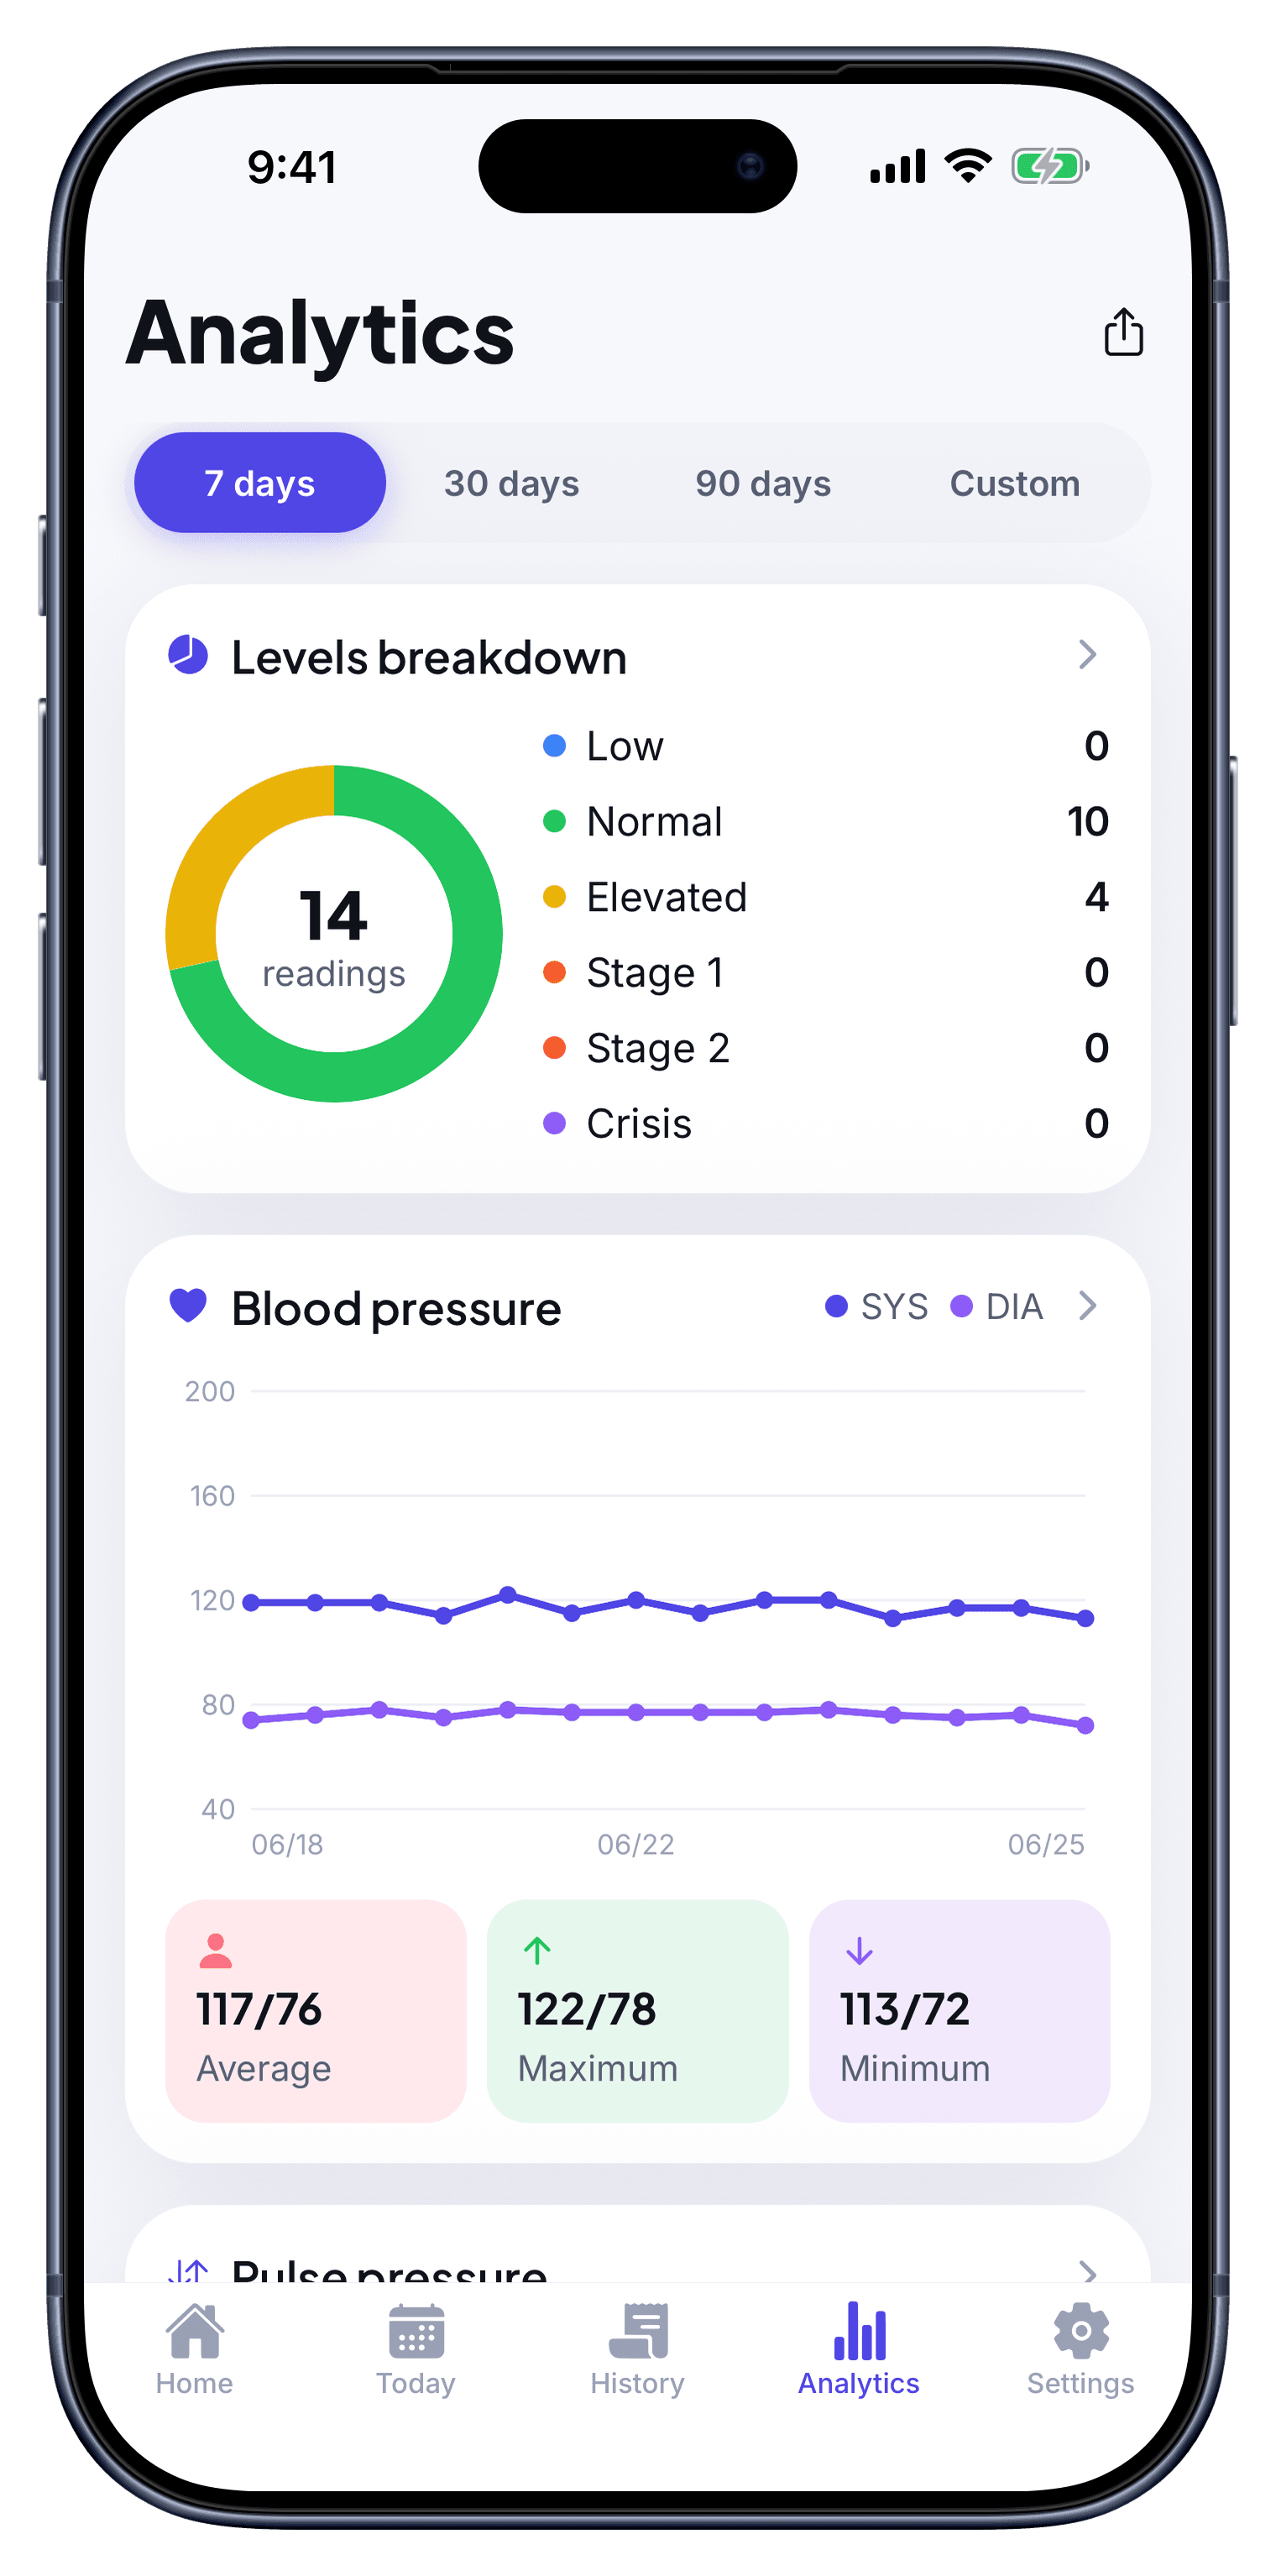
See your trends & insights
As your log grows, BPlus shows the shape of it: systolic and diastolic over 7, 30 or 90 days, your average, high and low, and how often you land in each category. Smart insights surface the meaningful changes — like “systolic down 3 mmHg this week” — so you always know whether things are heading the right way.
- Trend lines & levels breakdown
- Average, max and min at a glance
- Goal tracking toward ≤ 120/80
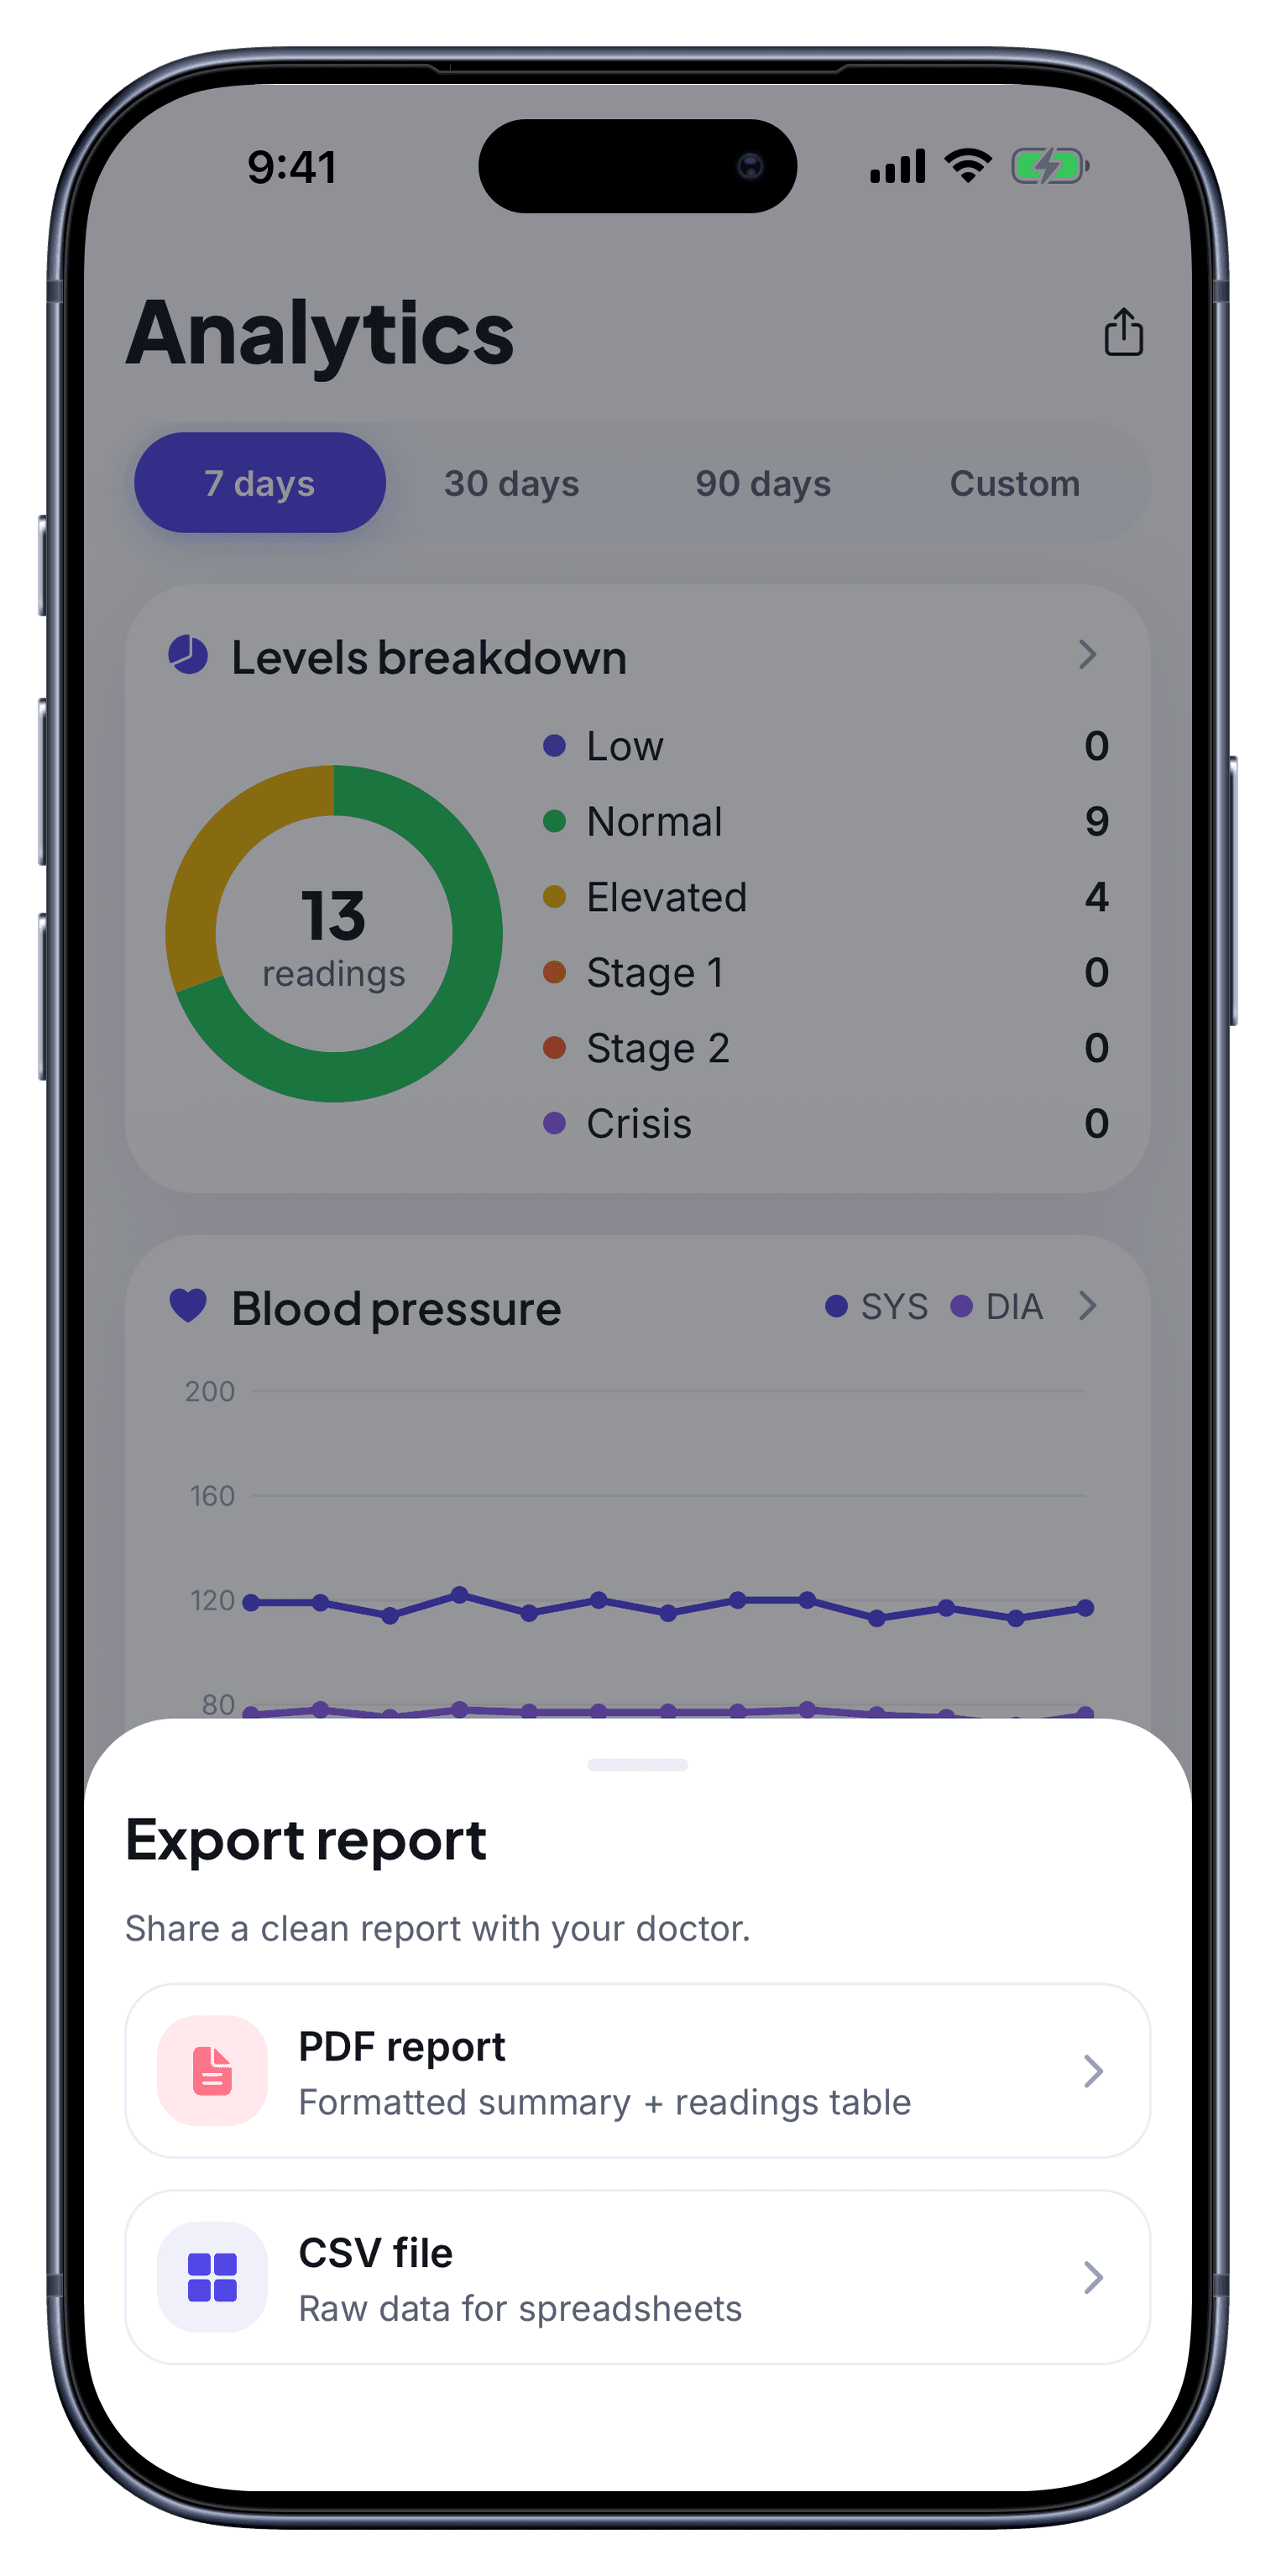
Export a report for your doctor
When it is time to see your clinician, export a tidy report of your readings, averages, categories and trends as a PDF or CSV. Bring it to the visit or send it ahead — so the conversation starts from real data instead of a guess about how you have been feeling.
- Doctor-ready PDF or CSV
- Readings, averages & categories
- Share or print in one tap
You measure. BPlus makes sense of it.
BPlus never takes a reading from your body or your phone. You use your own validated monitor, and BPlus does the rest — capturing, organizing and explaining your numbers.
BPlus does not measure your blood pressure
Your phone is not a cuff
It does not diagnose or treat
Start your blood-pressure log today
It takes one reading to begin. Log it, track it, and bring real numbers to your next visit.
Normal · Elevated · Stage 1 · Stage 2 · Crisis